About
This post contains the dashboard I built to go along with my data cleaning project where I clean up my own running data from college. Shoutout to Andy Kriebel and his awesome YouTube video for getting me started!
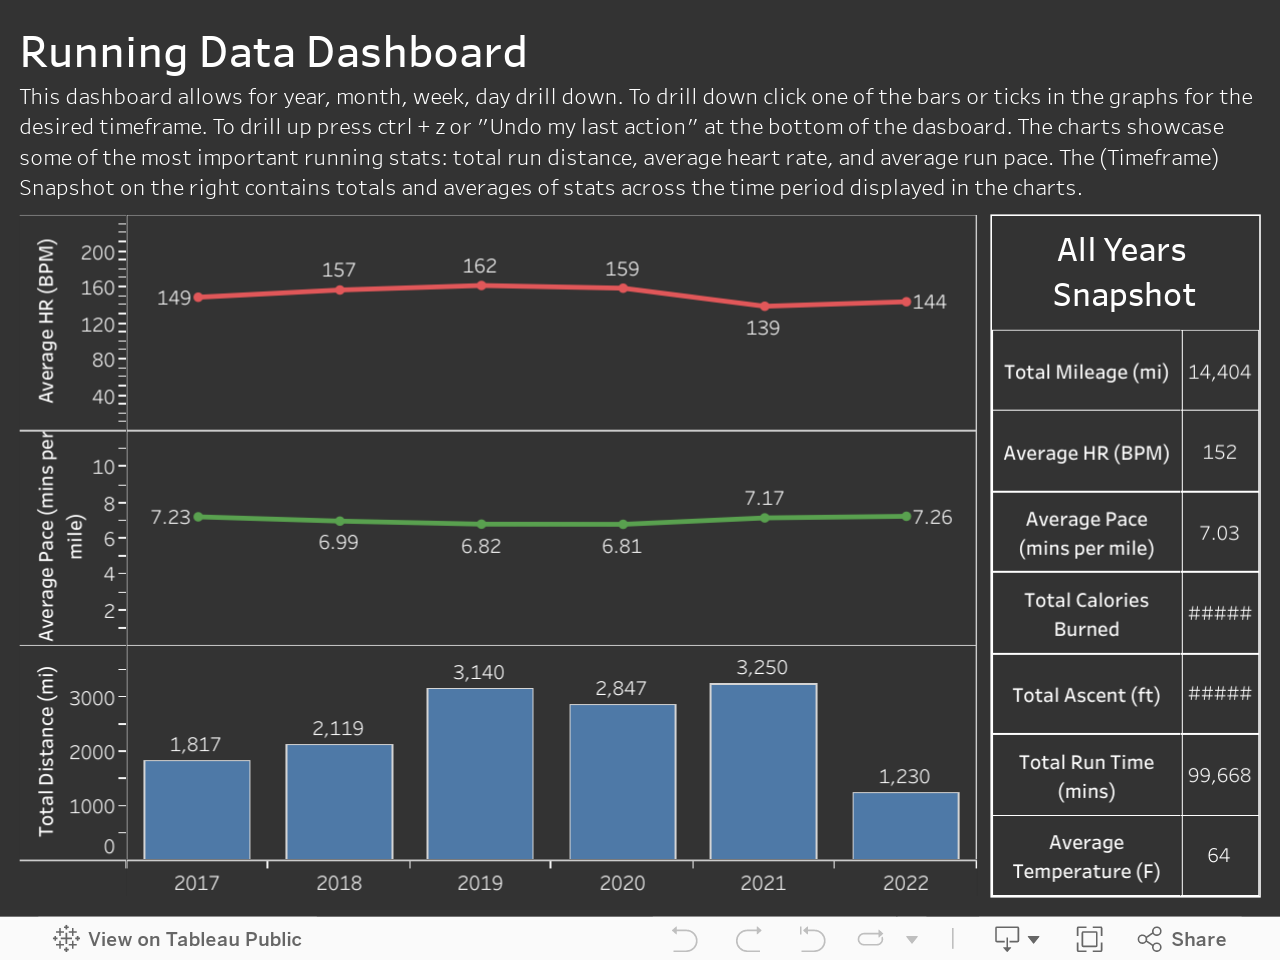
The dashboard allows for dynamic exploration of the time series data from years down to days. I would recommend opening up the visualization to full screen, so you can see the “timeframe snapshots” along with my most important running stats.
The Dashboard